2021 Results for "Seriously Considering Suicide" in a large sample of US High School Students
An analysis of the CDC's 2021 Youth Behavior Risk Survey indicates that longer trends are probably a bigger consideration than everyone's focus on the pandemic would indicate.
In today's post, I'm diving into the brand new results of the CDC's latest Youth Risk Behavior Surveillance System (YRBSS) survey, done in 2021, the first released since the start of the coronavirus pandemic. They YBRSS is a comprehensive biennial survey that aims to monitor health-risk behaviors among youth in the United States. It covers a wide range of topics, including behaviors related to mental health, substance use, violence, sexual behavior, nutrition, and physical activity.
The demographics of the YRBSS participants include a nationally representative sample of high school students, generally aged between 14 and 18 years. The survey strives to include students from diverse racial, ethnic, and socioeconomic backgrounds, as well as those from various geographical locations across the United States. This ensures that the findings provide a comprehensive and accurate representation of the health-risk behaviors among the nation's youth population.
Today, we are going to focus on the question related to suicidal thinking among high school students. It asks participants to report if they have “seriously considered attempting suicide within a the past 12 months.” This is a self-reported survey; there are pitfalls obviously to this but it comes directly from the answers provided by high school youth and as it’s been asked sequentially since 1991 it provides as well a good benchmark for the answer to this question.
A quick data caveat: this is not longitudinal data. This is repeated cross-sectional data on a single question in different populations. This does open up a number of potential confounding factors, but do remember that every two years it’s a different group of kids answering the questions!)
This is the “headline graphic” - the overall results for all students (n=16,927):

Many articles and comments will be written about the pandemic and its effect on kids in creating this 25 year (but not 27-year) high, but another view might also shed some light on the trends: the survey-to-survey changes.

I hope that there is space in the conversation for the acknowledgement that after almost 20 years of falling rates of suicidal thinking until 2009, there has been a general increase since then. Compared to 2009 responses, youth in 2021 were 60% more likely to report serious suicidal thinking. The 2021 number, which has and will grab more headlines, is an increase to be certain (both visually and statistically, the largest at 18%), but a 14% increase occurred in 2011 with no pandemic to blame and increases have occurred in all but 2 of the 6 surveys.
We can also see that as soon as we move away from totals we are left with a significant finding: in subpopulations of the survey, the increases in 2021 may be larger or smaller than previous years.
Breakdowns by sex.
(NB: like for race, I don’t get to control the way CDC asks its questions. This is a question on sex, not gender, and the categories, like the racial categories below, are the wording choice of the CDC. I am trying to do participants a solid by calling them girls and boys, but I am referring to their answer to the question on “sex.”)
For boys: a non-significant change, well within previous trends and quite smaller than previous years increases.
For girls: a significant change, and the highest change on record.
Breakdowns by race and sex.
For Black girls: we see an increase (confidence intervals barely overlap) in 2021, however it should be noted that the confidence intervals are wide and we can draw a relatively large straight line through the trend from 2015 including these intervals. (Try to see if you can draw those lines in any of the other upcoming graphics)
For Black boys: we see again an increase in 2021 but well within a longstanding trend. If anything, pay most attention to the statistical oddity of the 2017 year, which represents, to me, the exact pitfalls and challenges interpreting of sequential cross-sectional data on different kids.
For Asian students: we see a decrease in 2021 within previous trends, the decrease comes almost entirely by males (-32%, statistically significant) and not in females (+10%, not statistically significant)
For Hispanic students: we see a large leap in 2021, not part of previous trends, and well in excess of previous year changes. This is true in both girls and boys.
For Indigenous students: (Responses in the “American Indian or Alaskan Native” category), we saw no increase in 2021. This is true for both boys (non-significant decrease) and girls (no change).
For Native Hawai’ian and Pacific Islander students, we see a non-significant increase (boys only, girls had a non-significant decrease).The trend, overall, has the appearance of a gradually declining rate from 1999.
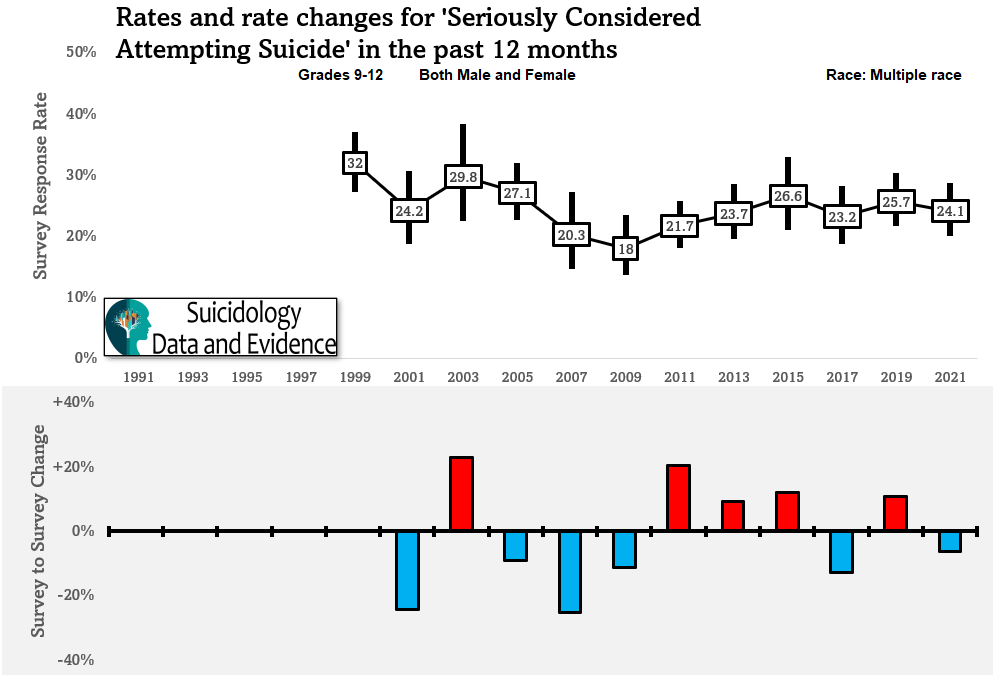
For Mixed Race students, we see no significant changes, and a general trend of decrease. This holds for both boys and girls.
And finally, for white students, we see numbers that mimic the overall survey, owing to the statistical knowledge that more than half of the sample is white. The breakdowns between boys and girls are the about same as the first graph, as well.
As you can see, the moment we interject the subpopulation analysis into the equation, we see that “an increase in 2021” is only sometimes true, though obviously, more true than not. Statistically, this feels to me that the answer is closer to “the same or higher” than “lower or higher,” as none of the breakdowns to this point are statistically significant.
The most complete breakdown list ever.
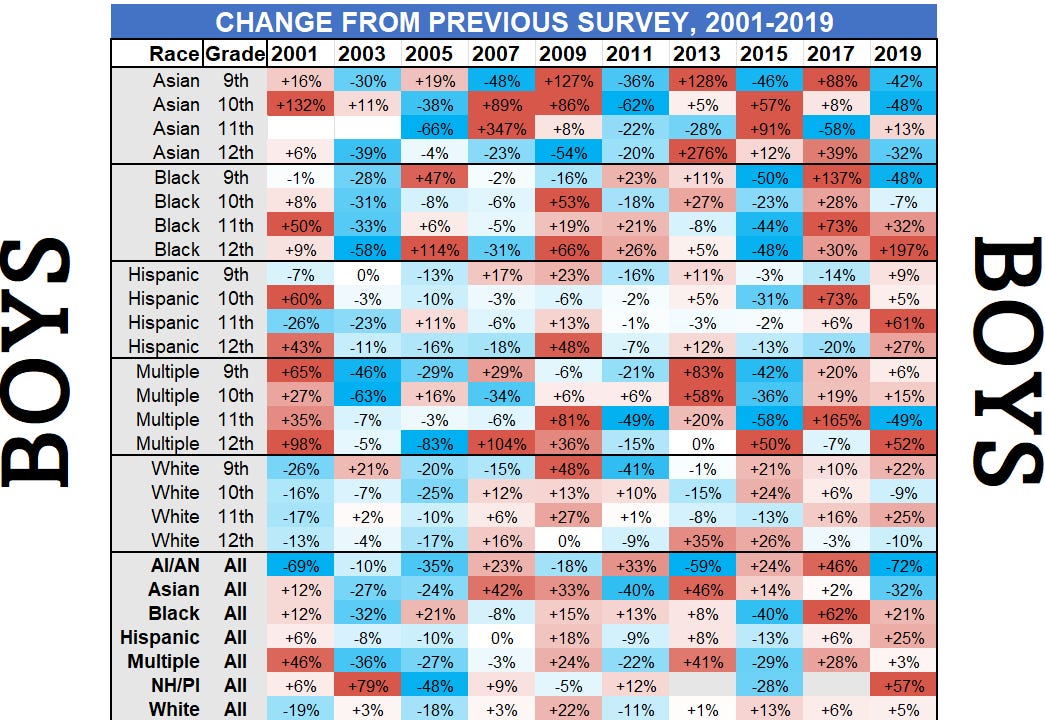
But wait, there’s more! We actually have grade-by-grade data, and here’s where it gets even more complex. For example, these two tables illustrate the complexity of the statement that “suicidal ideation increased for girls and not boys in the YBRS”:
Remember I said it was complex?
The statement “suicidal ideation increased for girls” is supported by the data on Black, Hispanic, and white girls but not Asian, Indigenous, Pacific Islander, or Multiple-Race girls.
OK then, so are we good?! No. The statement “suicidal ideation increased for Black, Hispanic, and white girls” is true for Grade 12 girls completely or Hispanic Grade 9 girls.
While boys typically did much better this round than previous surveys, that is NOT true for Black Grade 12 boys, or Hispanic Grade 11 boys, or Pacific Islander boys in general.
This is a great example of Simpson’s paradox; because of the uneven size of the different demographic groups, individual group trends are hidden, or sometimes even the opposite, of the summed-group trends. As well, the focus on 2019 to 2021 changes brings in a number of biases and errors when claiming that the coronavirus is responsible for the changes, like neglecting previous trends (for many groups, the overall trend holds and doesn’t change), and the temporal fallacy (the only evidence is “time”, in this case between 2019 and 2021. There are a lot of confounders that are missed, and the pandemic is NOT the only change that children experienced. What do you suppose the effect would be if I had another “breakdown” like sexuality? Or perhaps “living in poverty?” I love surveys and cross sectional data, but they are best seen, like all uncontrolled data, as investigation starters, not cause finders.
Whenever speaking confidently about statistical trends, always try and be clear
The bottom line: Singular statements, and singular cause attribution, are quite problematic when discussing cross-sectional survey data, even if it’s longitudinal.
Cross sectional surveys do not address direction of the association (cause), and longitudinal surveys do not address any factors (pandemic, schooling, racial tension, transphobia, bullying, etc) other than time. Combining the two does not establish cause. When it is something as important as “what is going on with suicidal ideation in kids,” being simplistic, using multiple fallacies, and bringing in preconceived biases and moral panic is not the pathway to truth.
I am ever-grateful for the data that the CDC provides in these surveys, but we have to be thorough and robust in our analysis. In the coming weeks, I will get really into the weeds in the “seriously considered suicide” statistic and see what factors were related in the 2021 survey. The CDC did a good job here (while unfortunately making a few of the declarative mistakes I’m cautioning against), but we can dive a little deeper.


