Mythbusting Suicide: The Ages of Suicide
Statistics fail to demonstrate that suicide is "more common in kids and the elderly"
Do you know SADPERSONS? It’s a mnemonic and a suicidal assessment scale that’s been in use for decades. Yet, SADPERSONS, how I detest thee. It’s one of the only scales I’m aware of that is still in clinical use despite knowledge that it’s probably harmful.
One of the criteria for SADPERSONS, which makes up the “A,” reads as the following
Original criteria:
Age (<19 or >45 years)
Modified criteria:
Age 15-25 or 59+ years
This myth, that I call the “bimodal distribution of extremes myth,” goes like this: Suicides are most common in the very young and very old.
Quite simply, this has never been the case. Yep. Every textbook you’ve read that in. Wrong! Every lecturer who has told it to you, wrong! That article you read, wrong!
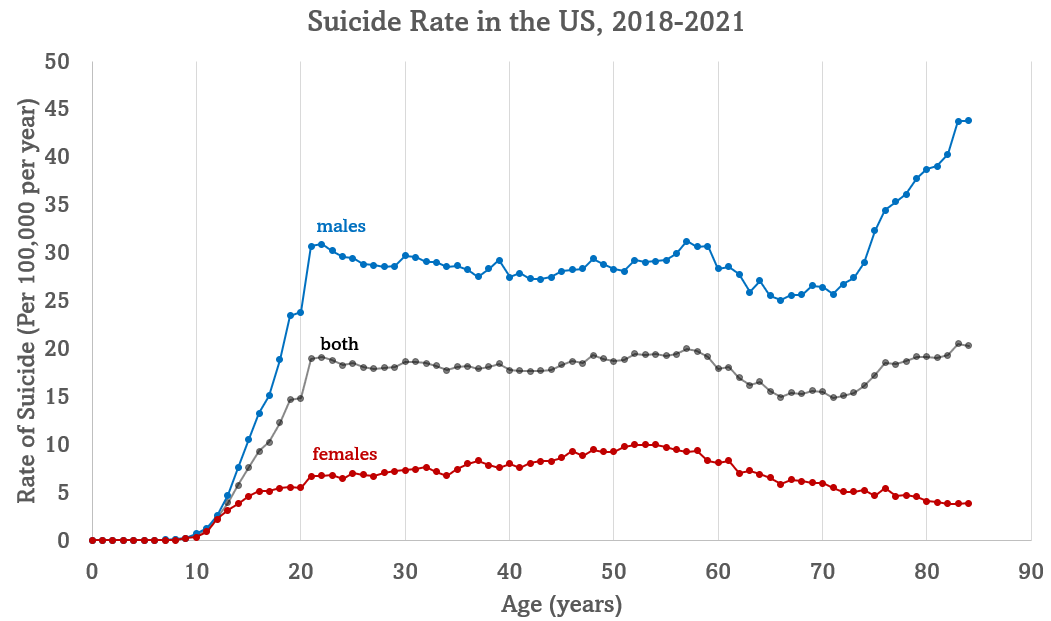
It’s also, sadly, very easy to debunk this myth. I can run over to CDC Wonder right now, and whip this up in under 5 minutes (maybe you can tell from the quality of the graph)

Contrary to the myth that is prevalent in clinical teaching materials and textbooks all over the world, Youth have the lowest rates of suicide out of all ages until the age of 20. The elderly certainly have increasing rates of suicide, but they return to 20-60 year levels.
However, and this is where I can exercise a bit of delinquency. Feel free to deface those textbooks! Give a hearty “ahem~!” and correct that instructor. Increasing age is not a risk factor for suicide, however age is in males and for females has a different relationship.
For men, we see:
general increase to age 21
a plateau for 40 years
a decrease from 60 to 75, and then
an increase again to new heights.
For women, we see:
a gradual curved expansion all the way to 55, and then
a decrease after that
A better statistical way to view this is to create odds ratios (for something as rare as suicide, it is almost identical to the relative risk), that is, what is the likelihood of death by suicide vs nondeath in a given year compared to some standard? Looking at the above, let’s compare each year’s odds of suicide as a ratio to the odds of suicide at age 42.
By visualizing it this way, we see the differences very clearly. Suicide risk is much lower in adolescents (in fact, it falls off the logarithmic graph at the young ages). It plateaus at age 20 and generally remains in that vicinity for most of adulthood, and then for women and men we see two trajectories: women’s suicides decrease while men’s increase.
In fact, if we add another variable, racial category (CDC 5-race group) we see that things are even more complex:
To try to put the above graph into a paragraph (deep breath): the general shape of females having a midlife peak for suicide is only true for white females and not at all true for other groups, most notably Indigenous females, whose rates of suicide from 15 to 35 represent astronomically high rates. The increasing rates of suicide in elderly age are true for white males in the US but not true for Asian or Black males in the US, but possibly for Hispanic and Indigenous males. The dominance of white Americans hides the very different graphs for different racial groups, and this is taking into consideration the extremely problematic grouping of CDC race. Try to fit that on a mnemonic!
So, let’s call this age myth what it is, busted and devoid of any statistical foundation.


